




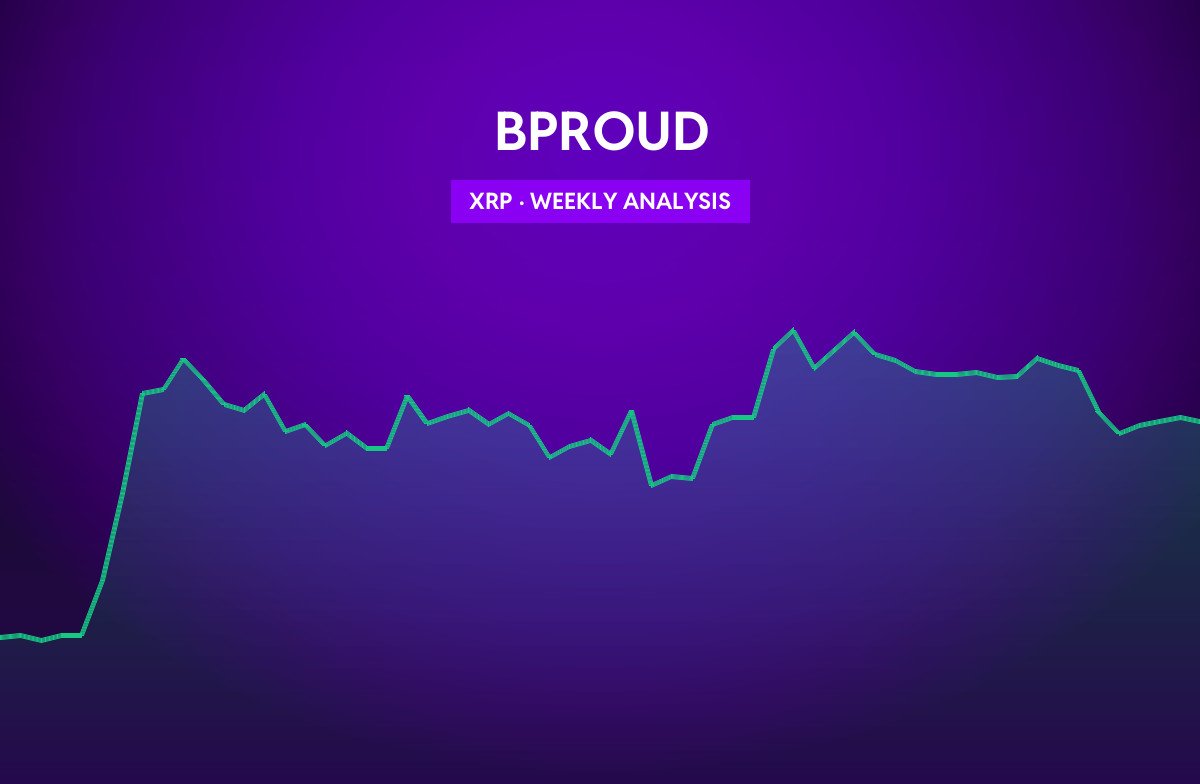
XRP starts the week at $1.40, -7.01% over the past seven days and +2.61% over 30 days. Last week’s range ran from $1.32 to $1.52. XRP sits between its key moving averages — above some and below others — so the trend picture is mixed.
Summary
- Trend: Mixed (price vs. EMA 20 / 50 / 200)
- Momentum: daily RSI(14) at 44.5 — below the midline, pointing to soft momentum
- Volatility: average true range of $0.0537 per day (3.83% of price)
- Support / resistance: $1.25 / $1.66 (30-day range)
Trend and moving averages
| Indicator | Level | XRP vs. level |
|---|---|---|
| EMA 20 (daily) | $1.44 | -2.88% |
| EMA 50 (daily) | $1.40 | +0.19% |
| EMA 200 (daily) | $1.38 | +1.64% |
The 20-day EMA is above the 50-day EMA, so short-term momentum is leading the medium-term trend higher. Trading volume over the past week is -48% versus the 30-day average, showing thinner participation.
Key levels to watch
| Level | Price | Distance |
|---|---|---|
| 90-day high | $1.70 | +21.25% |
| 30-day high (resistance) | $1.66 | +18.27% |
| Last week’s high | $1.52 | +8.69% |
| Last week’s low | $1.32 | -5.96% |
| 30-day low (support) | $1.25 | -10.99% |
| 90-day low | $0.9872 | -29.59% |
Scenarios for the week
Upside: a daily close above last week’s high at $1.52 would put the 30-day high at $1.66 in focus.
Downside: losing last week’s low at $1.32 would expose 30-day support around $1.25.
With a daily ATR of about $0.0537, a stop placed one ATR away from entry is roughly 3.8% — use the position size calculator to size trades around that distance.
Recent XRP headlines
- Why a bug that could have threatened XRP's 100 billion supply cap stayed hidden for years — CoinDesk
- XRP Ledger defends emergency patch for unlimited XRP bug — Cointelegraph
- Ledger attack spreads to EU, AI finds ’18 trillion XRP’ bug: Hodler’s Digest — Cointelegraph
- Stellar Now Hosts More Tokenized Assets Than the XRP Ledger. Why Is XRP Still Worth Nearly 13 Times More? — Yahoo Finance
Track XRP live on its price page and check this week’s macro events on the economic calendar.
This analysis is generated automatically from daily exchange data (Binance / OKX / Kraken) on October 12, 2026. Technical levels describe past price behaviour and are not a forecast or financial advice.
