




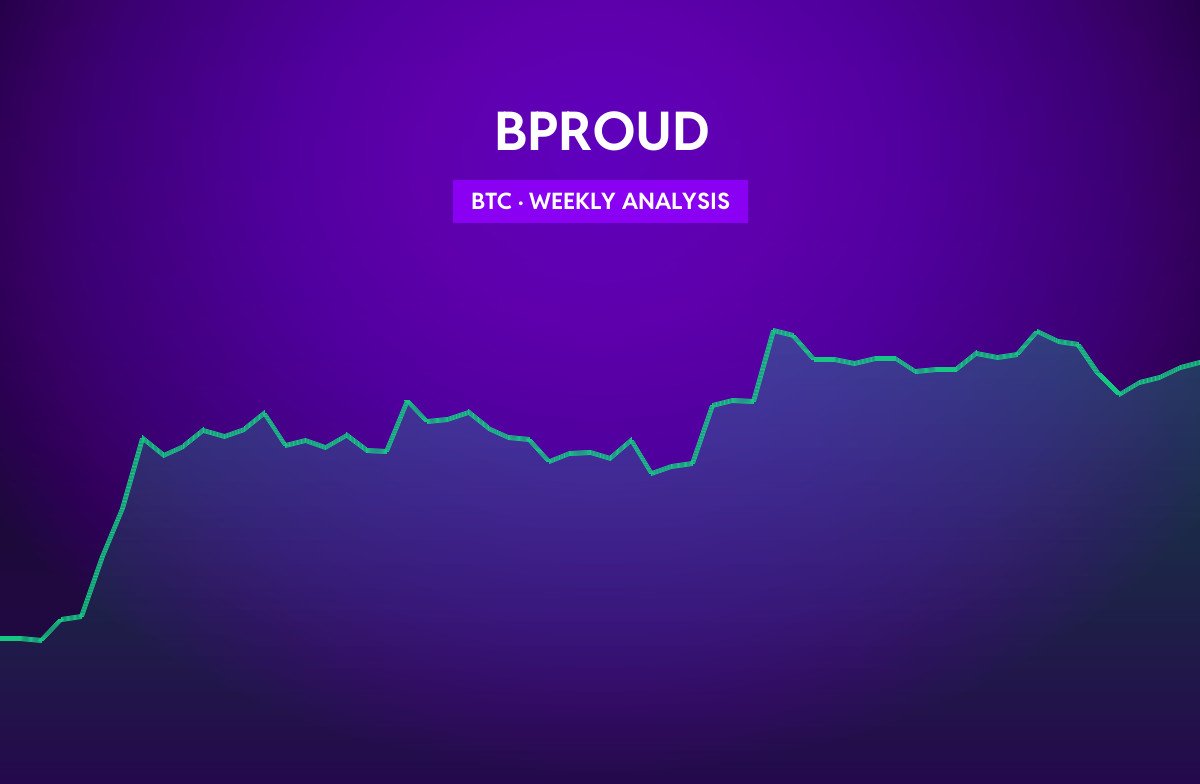
Bitcoin starts the week at $84,140, -1.89% over the past seven days and +8.88% over 30 days. Last week’s range ran from $80,400 to $86,694. BTC trades above its 20-, 50- and 200- day exponential moving averages, a constructive trend structure.
Summary
- Trend: Bullish (price vs. EMA 20 / 50 / 200)
- Momentum: daily RSI(14) at 55.9 — above the midline, pointing to positive momentum
- Volatility: average true range of $1,925 per day (2.29% of price)
- Support / resistance: $74,956 / $87,399 (30-day range)
Trend and moving averages
| Indicator | Level | BTC vs. level |
|---|---|---|
| EMA 20 (daily) | $83,375 | +0.92% |
| EMA 50 (daily) | $80,213 | +4.90% |
| EMA 200 (daily) | $75,742 | +11.09% |
The 20-day EMA is above the 50-day EMA, so short-term momentum is leading the medium-term trend higher. Trading volume over the past week is -22% versus the 30-day average, showing thinner participation.
Key levels to watch
| Level | Price | Distance |
|---|---|---|
| 90-day high | $87,399 | +3.87% |
| 30-day high (resistance) | $87,399 | +3.87% |
| Last week’s high | $86,694 | +3.04% |
| Last week’s low | $80,400 | -4.44% |
| 30-day low (support) | $74,956 | -10.92% |
| 90-day low | $62,269 | -25.99% |
Scenarios for the week
Upside: a daily close above last week’s high at $86,694 would put the 30-day high at $87,399 in focus.
Downside: losing last week’s low at $80,400 would expose 30-day support around $74,956.
With a daily ATR of about $1,925, a stop placed one ATR away from entry is roughly 2.3% — use the position size calculator to size trades around that distance.
Derivatives
Perpetual funding for BTC is 0.0013% per 8 hours on OKX (longs paying shorts), with open interest of $2.47B. Funding is moderate, suggesting positioning is not stretched.
Recent Bitcoin headlines
- STRK Gains 322% in Four Weeks, Outpacing Bitcoin and Ether — The Defiant
- Bitcoin Rises After Trump Announces Ukraine-Russia Energy Ceasefire — Market Talk — Moomoo
- Bitcoin recovers to near $84k as falling oil prices offer some support — Google News
- Bitcoin RSI Explained: What 70 and 30 Really Mean — CryptoTicker
Track BTC live on its price page and check this week’s macro events on the economic calendar.
This analysis is generated automatically from daily exchange data (Binance / OKX / Kraken) on October 12, 2026. Technical levels describe past price behaviour and are not a forecast or financial advice.
