




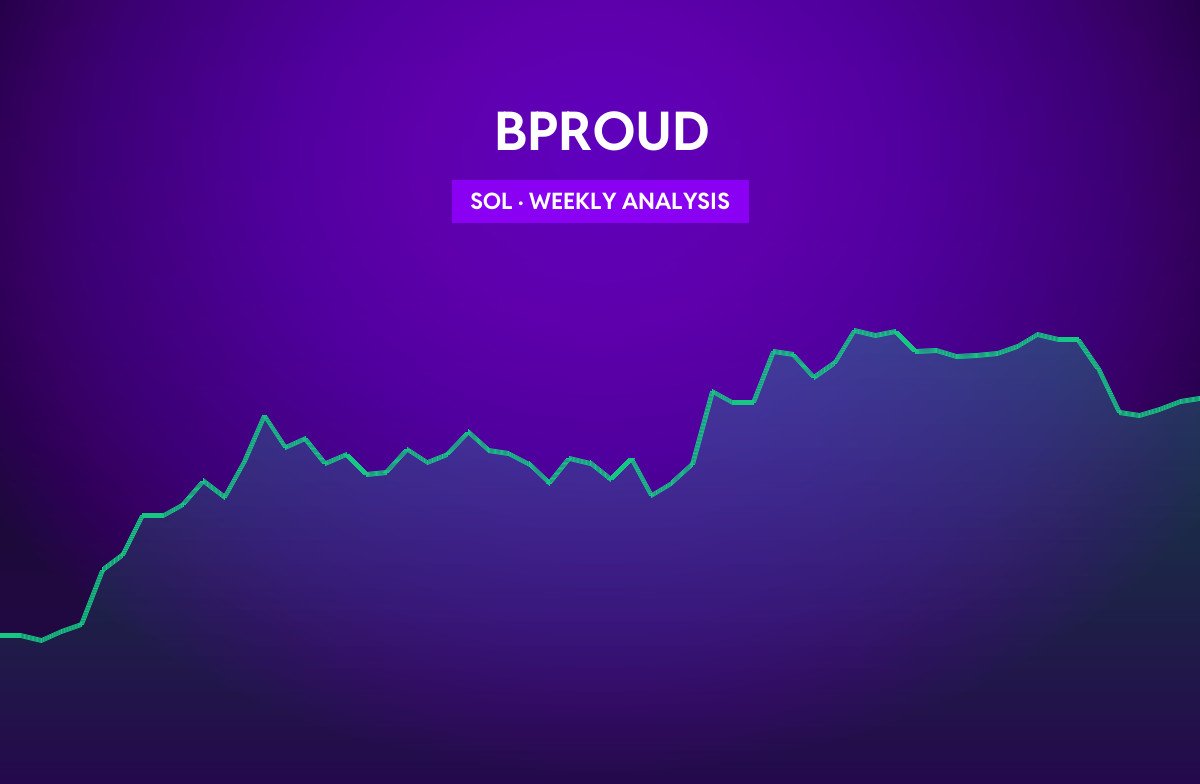
Solana starts the week at $111.74, -7.49% over the past seven days and +9.80% over 30 days. Last week’s range ran from $105.71 to $122.00. SOL sits between its key moving averages — above some and below others — so the trend picture is mixed.
Summary
- Trend: Mixed (price vs. EMA 20 / 50 / 200)
- Momentum: daily RSI(14) at 47.6 — near the neutral 50 line
- Volatility: average true range of $4.25 per day (3.80% of price)
- Support / resistance: $95.79 / $124.96 (30-day range)
Trend and moving averages
| Indicator | Level | SOL vs. level |
|---|---|---|
| EMA 20 (daily) | $114.04 | -2.01% |
| EMA 50 (daily) | $107.71 | +3.74% |
| EMA 200 (daily) | $98.03 | +13.98% |
The 20-day EMA is above the 50-day EMA, so short-term momentum is leading the medium-term trend higher. Trading volume over the past week is -30% versus the 30-day average, showing thinner participation.
Key levels to watch
| Level | Price | Distance |
|---|---|---|
| 90-day high | $124.96 | +11.83% |
| 30-day high (resistance) | $124.96 | +11.83% |
| Last week’s high | $122.00 | +9.18% |
| Last week’s low | $105.71 | -5.40% |
| 30-day low (support) | $95.79 | -14.27% |
| 90-day low | $70.58 | -36.84% |
Scenarios for the week
Upside: a daily close above last week’s high at $122.00 would put the 30-day high at $124.96 in focus.
Downside: losing last week’s low at $105.71 would expose 30-day support around $95.79.
With a daily ATR of about $4.25, a stop placed one ATR away from entry is roughly 3.8% — use the position size calculator to size trades around that distance.
Derivatives
Perpetual funding for SOL is 0.0100% per 8 hours on OKX (longs paying shorts), with open interest of $340.36M. Funding is moderate, suggesting positioning is not stretched.
Recent Solana headlines
- Solana ETFs End a 14-Week Buying Streak With Their Largest Weekly Exit — Yahoo Finance
- Sui Soars 48% in Just One Month: Could It Be the Next Solana? — Yahoo Finance
- Bitcoin, Ethereum and Solana ETFs All in the Red for October — Decrypt
Track SOL live on its price page and check this week’s macro events on the economic calendar.
This analysis is generated automatically from daily exchange data (Binance / OKX / Kraken) on October 12, 2026. Technical levels describe past price behaviour and are not a forecast or financial advice.
