




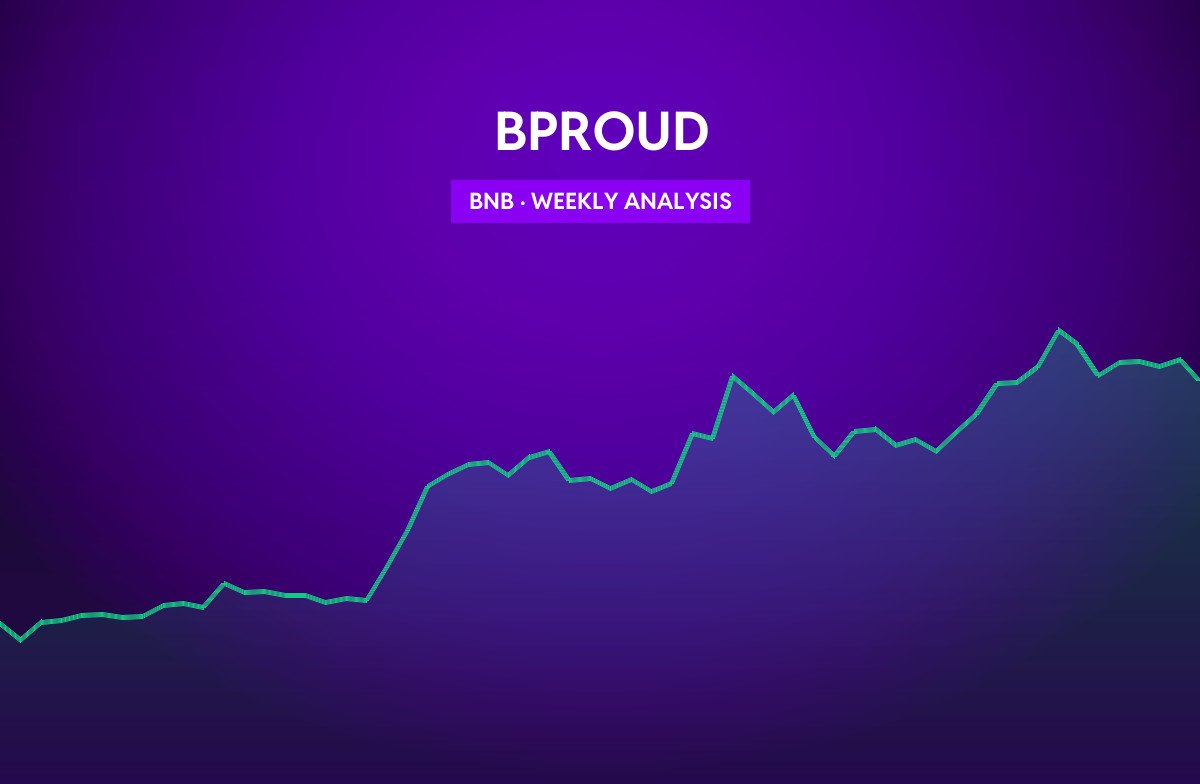
BNB starts the week at $763.00, -4.58% over the past seven days and +10.18% over 30 days. Last week’s range ran from $756.70 to $801.20. BNB trades above its 20-, 50- and 200- day exponential moving averages, a constructive trend structure.
Summary
- Trend: Bullish (price vs. EMA 20 / 50 / 200)
- Momentum: daily RSI(14) at 56.3 — above the midline, pointing to positive momentum
- Volatility: average true range of $24.15 per day (3.17% of price)
- Support / resistance: $674.70 / $807.70 (30-day range)
Trend and moving averages
| Indicator | Level | BNB vs. level |
|---|---|---|
| EMA 20 (daily) | $754.77 | +1.09% |
| EMA 50 (daily) | $712.48 | +7.09% |
| EMA 200 (daily) | $679.67 | +12.26% |
The 20-day EMA is above the 50-day EMA, so short-term momentum is leading the medium-term trend higher. Trading volume over the past week is -36% versus the 30-day average, showing thinner participation.
Key levels to watch
| Level | Price | Distance |
|---|---|---|
| 90-day high | $807.70 | +5.86% |
| 30-day high (resistance) | $807.70 | +5.86% |
| Last week’s high | $801.20 | +5.01% |
| Last week’s low | $756.70 | -0.83% |
| 30-day low (support) | $674.70 | -11.57% |
| 90-day low | $537.20 | -29.59% |
Scenarios for the week
Upside: a daily close above last week’s high at $801.20 would put the 30-day high at $807.70 in focus.
Downside: losing last week’s low at $756.70 would expose 30-day support around $674.70.
With a daily ATR of about $24.15, a stop placed one ATR away from entry is roughly 3.2% — use the position size calculator to size trades around that distance.
Track BNB live on its price page and check this week’s macro events on the economic calendar.
This analysis is generated automatically from daily exchange data (Binance / OKX / Kraken) on September 28, 2026. Technical levels describe past price behaviour and are not a forecast or financial advice.
