





Archived edition from November 9, 2026. Latest version: XRP Price Analysis: Levels, Funding and Outlook
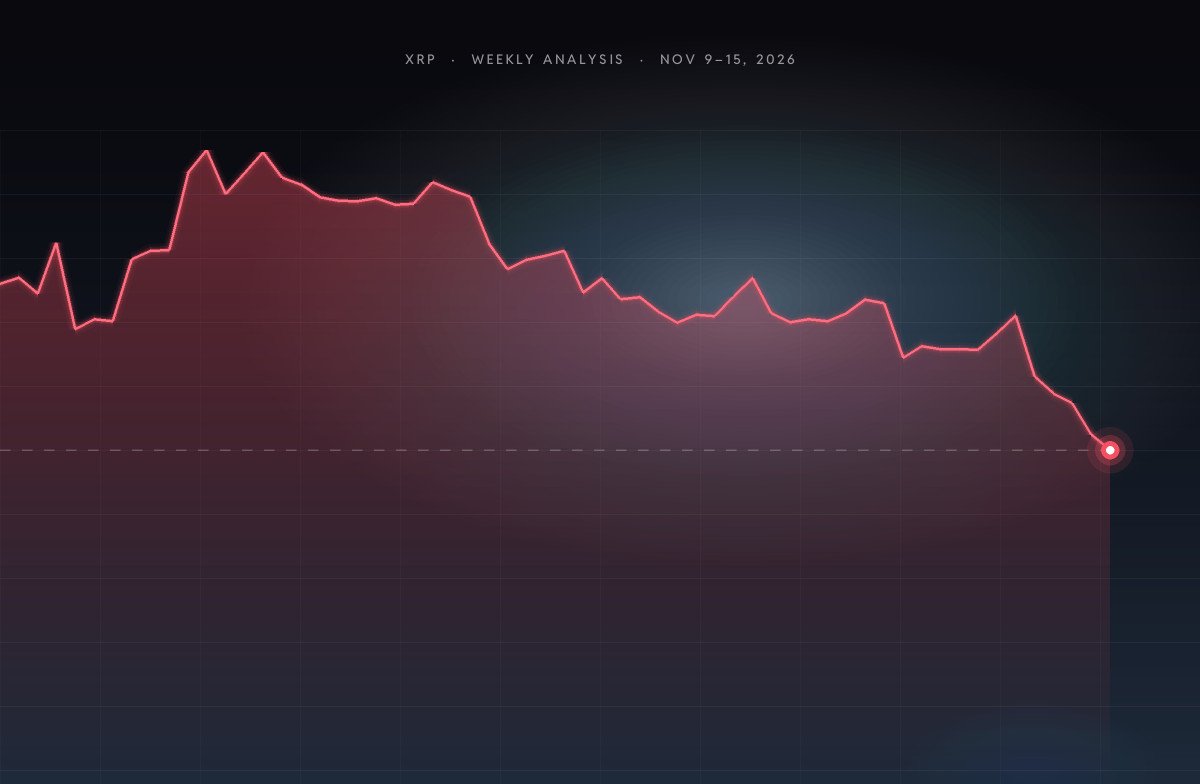
XRP starts the week at $1.09, -12.93% over the past seven days and -22.36% over 30 days. Last week’s range ran from $1.08 to $1.34. XRP trades below its 20-, 50- and 200- day exponential moving averages, which keeps the trend structure defensive.
Summary
- Trend: Bearish (price vs. EMA 20 / 50 / 200)
- Momentum: daily RSI(14) at 25.8 — in oversold territory, where selling pressure often starts to exhaust
- Volatility: average true range of $0.0574 per day (5.28% of price)
- Support / resistance: $1.08 / $1.43 (30-day range)
Trend and moving averages
| Indicator | Level | XRP vs. level |
|---|---|---|
| EMA 20 (daily) | $1.24 | -12.25% |
| EMA 50 (daily) | $1.30 | -16.40% |
| EMA 200 (daily) | $1.35 | -19.45% |
The 20-day EMA is below the 50-day EMA, so short-term momentum is lagging the medium-term trend. Trading volume over the past week is +46% versus the 30-day average, showing increased participation.
Key levels to watch
| Level | Price | Distance |
|---|---|---|
| 90-day high | $1.70 | +56.16% |
| 30-day high (resistance) | $1.43 | +31.06% |
| Last week’s high | $1.34 | +23.28% |
| Last week’s low | $1.08 | -0.62% |
| 30-day low (support) | $1.08 | -0.62% |
| 90-day low | $0.9872 | -9.31% |
Scenarios for the week
Upside: a daily close above last week’s high at $1.34 would put the 30-day high at $1.43 in focus.
Downside: losing last week’s low at $1.08 would expose the 90-day low around $0.9872.
With a daily ATR of about $0.0574, a stop placed one ATR away from entry is roughly 5.3% — use the position size calculator to size trades around that distance.
Recent XRP headlines
- Meta AI Predicts How Secure is XRP Following Recent Ripple Security Incident — Yahoo Finance
- XRP and Solana Both Hit 30-Day Lows This Week. Is It Better to Buy XRP or SOL Right Now? — Yahoo Finance
Track XRP live on its price page and check this week’s macro events on the economic calendar.
This analysis is generated automatically from daily exchange data (Binance / OKX / Kraken) on November 9, 2026. Technical levels describe past price behaviour and are not a forecast or financial advice.
Questions traders ask
What is the XRP (XRP) outlook for Nov 9–15, 2026?
Trend: Bearish (price vs. EMA 20 / 50 / 200). Momentum: daily RSI(14) at 25.8, in oversold territory, where selling pressure often starts to exhaust.
What are the key XRP support and resistance levels?
Support is at $1.08 and resistance at $1.43 (30-day range).
How volatile is XRP in the week of Nov 9–15, 2026?
Average true range of $0.0574 per day (5.28% of price).
How often is the XRP analysis updated?
Every week. BProud publishes a new weekly outlook for XRP and the other major coins, with live prices on the coins page.
