





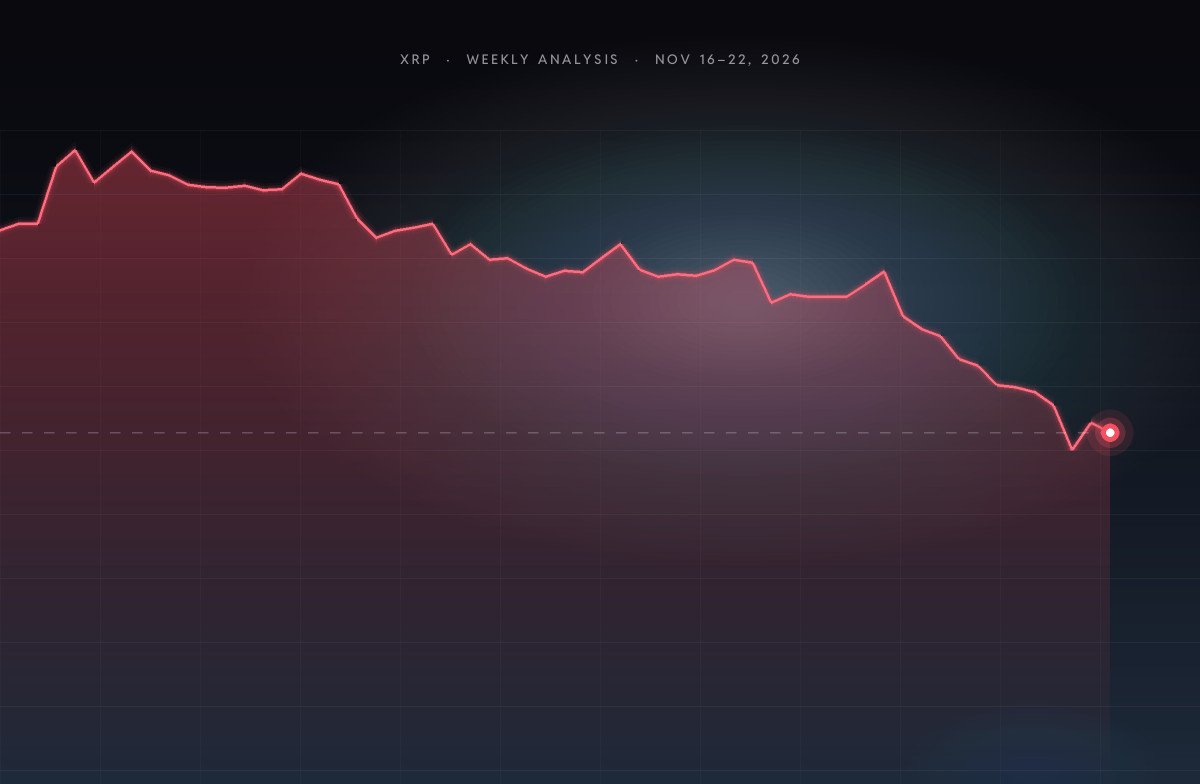
Archived edition from November 16, 2026. Latest version: XRP Price Analysis: Levels, Funding and Outlook
XRP starts the week at $0.9525, -13.33% over the past seven days and -26.40% over 30 days. Last week’s range ran from $0.8929 to $1.11. XRP trades below its 20-, 50- and 200- day exponential moving averages, which keeps the trend structure defensive.
Summary
- Trend: Bearish (price vs. EMA 20 / 50 / 200)
- Momentum: daily RSI(14) at 25.7 — in oversold territory, where selling pressure often starts to exhaust
- Volatility: average true range of $0.0661 per day (6.94% of price)
- Support / resistance: $0.8929 / $1.40 (30-day range)
Trend and moving averages
| Indicator | Level | XRP vs. level |
|---|---|---|
| EMA 20 (daily) | $1.12 | -14.64% |
| EMA 50 (daily) | $1.23 | -22.43% |
| EMA 200 (daily) | $1.32 | -27.77% |
The 20-day EMA is below the 50-day EMA, so short-term momentum is lagging the medium-term trend. Trading volume over the past week is +25% versus the 30-day average, showing increased participation.
Key levels to watch
| Level | Price | Distance |
|---|---|---|
| 90-day high | $1.70 | +78.48% |
| 30-day high (resistance) | $1.40 | +46.89% |
| Last week’s high | $1.11 | +16.15% |
| Last week’s low | $0.8929 | -6.26% |
| 30-day low (support) | $0.8929 | -6.26% |
| 90-day low | $0.8929 | -6.26% |
Scenarios for the week
Upside: a daily close above last week’s high at $1.11 would put the 30-day high at $1.40 in focus.
Downside: losing last week’s low at $0.8929 would mean new 90-day lows.
With a daily ATR of about $0.0661, a stop placed one ATR away from entry is roughly 6.9% — use the position size calculator to size trades around that distance.
Recent XRP headlines
Track XRP live on its price page and check this week’s macro events on the economic calendar.
This analysis is generated automatically from daily exchange data (Binance / OKX / Kraken) on November 16, 2026. Technical levels describe past price behaviour and are not a forecast or financial advice.
Questions traders ask
What is the XRP (XRP) outlook for Nov 16–22, 2026?
Trend: Bearish (price vs. EMA 20 / 50 / 200). Momentum: daily RSI(14) at 25.7, in oversold territory, where selling pressure often starts to exhaust.
What are the key XRP support and resistance levels?
Support is at $0.8929 and resistance at $1.40 (30-day range).
How volatile is XRP in the week of Nov 16–22, 2026?
Average true range of $0.0661 per day (6.94% of price).
How often is the XRP analysis updated?
Every week. BProud publishes a new weekly outlook for XRP and the other major coins, with live prices on the coins page.
