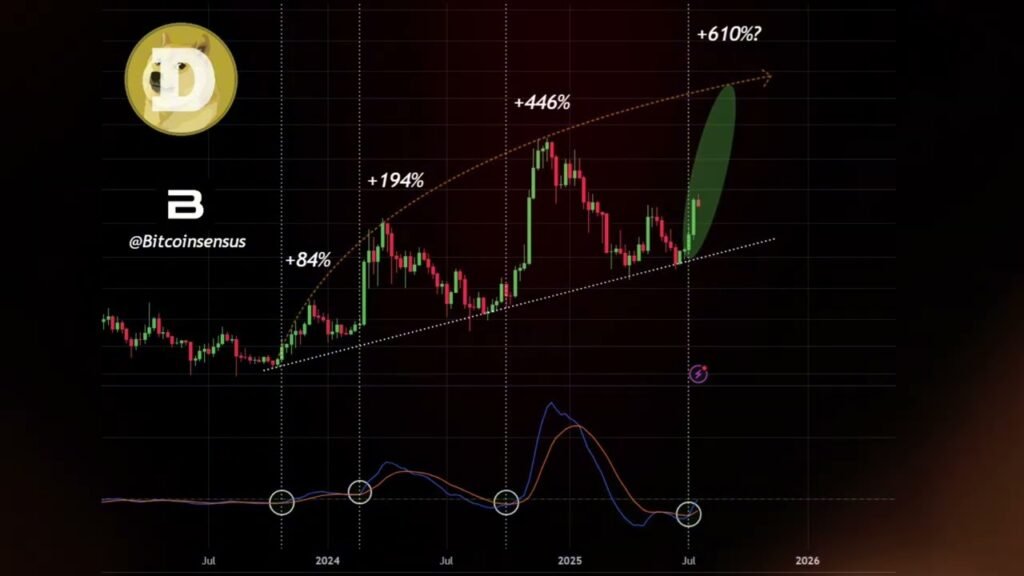
Welcome back. Let’s run through the biggest crypto macro moves you need to know this week. From Dogecoin cycles to Bitcoin and Ethereum’s latest charts, plus a quick altcoin spotlight. Let’s start with Dogecoin macro cycles. Dogecoin’s price history follows a surprisingly consistent three-phase pattern. It starts with a red falling wedge all about capitulation. Next, Doge moves into a blue ascending channel where quiet accumulation takes place. Then comes the explosive yellow vertical blast, the blowoff top. Cycle 1 saw gains of about 5,800%. Cycle 2 delivered a massive 21,000%. Right now, we’re midcycle 3, still inside that blue channel. If history repeats, Doge could target the $6 to $7 range. Next, Doge’s weekly momentum mark. On the weekly chart, Doge keeps posting higher lows anchored by a reliable dotted trend line. Every time the MACD crosses up from oversold, it’s triggered a major rally, 84%, 194%, then 446%. If the momentum mark holds, the next move could put Doge around 80, which is roughly a 610% projection. Now, let’s shift over to Bitcoin dominance. Bitcoin dominance has spent 5 years compressing inside a descending wedge. Every breakdown from the upper trend line brought a wave of altcoin outperformance. 11 weeks in 2018, 19 weeks in 2021. We’re testing resistance again and a move down toward 42% dominance could mean another strong alt season. Next up, Ethereum log channel and triangle breakout. Ethereum’s price on log scale has respected a rising pitchfork since 2016. After years of consolidation in a big symmetrical triangle, ETH just broke upward. Next key targets are in the 11 to$13,000 range with the upper rail near $22,000 if momentum continues. Now, let’s zoom out to Bitcoin’s yearly candles. Looking at Bitcoin’s yearly candles, diminishing returns are clear. 52 times in 2013, 14 times in 2017, 1.6 times in 2021. Now, with two green candles leading into 2025, history shows every posth having period includes at least one major bull run. If that trend continues, 2025 could see a close double this year’s open, hinting at 160 to 180,000 topside. Next, a quick check on veracity. Veracity has compressed into a classic falling wedge. If the breakout confirms the technical target is 1.5, a six times move from current prices. Risk is defined with invalidation below the lower trend line. Start trading these charts on BTCC and claim your crypto deposit reward from their $50,000 pool with built-in loss coverage protection. Plus, grab a 10% deposit bonus up to $100,000. Trade from a massive catalog of perpetual futures trading pairs and go allin with up to 500x leverage.
Previous ArticleSold out gems ready to rebound
Next Article Cardano (ADA) Price Prediction July 2025


